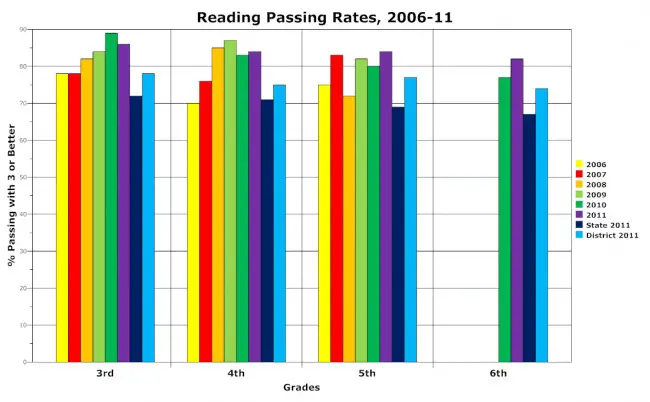
Belle Terre Elementary's FCAT Reading Success Rate
| The Numbers by Year | 3rd | 4th | 5th | 6th* |
|---|---|---|---|---|
| 2006 | 78 | 70 | 75 | 0 |
| 2007 | 78 | 76 | 83 | 0 |
| 2008 | 82 | 85 | 72 | 0 |
| 2009 | 84 | 87 | 82 | 0 |
| 2010 | 89 | 83 | 80 | 77 |
| 2011 | 86 | 84 | 84 | 82 |
| District 2010 | 78 | 77 | 74 | 72 |
| State 2010 | 72 | 72 | 69 | 67 |
| District 2011 | 78 | 75 | 77 | 74 |
| State 2011 | 72 | 71 | 69 | 67 |
![]()

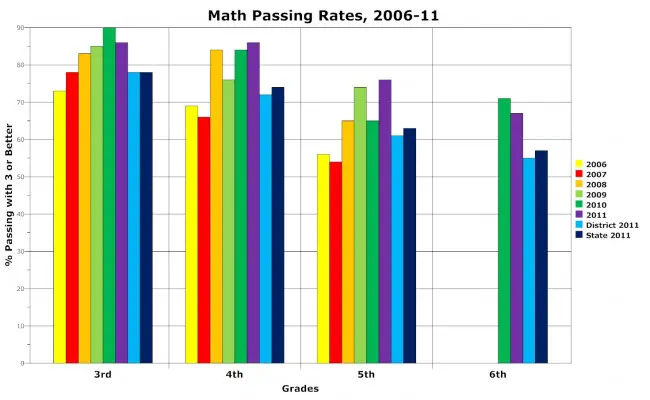
Belle Terre Elementary's FCAT Math Success Rate
| The Numbers by Year | 3rd | 4th | 5th | 6th* |
|---|---|---|---|---|
| 2006 | 73 | 69 | 56 | 0 |
| 2007 | 78 | 66 | 54 | 0 |
| 2008 | 83 | 84 | 65 | 0 |
| 2009 | 85 | 86 | 74 | 0 |
| 2010 | 90 | 84 | 65 | 71 |
| 2011 | 86 | 86 | 76 | 67 |
| District 2010 | 80 | 75 | 56 | 57 |
| State 2010 | 78 | 74 | 63 | 57 |
| District 2011 | 78 | 72 | 61 | 55 |
| State 2011 | 78 | 74 | 63 | 57 |


BTES staff says
Even though it was not mentioned in the article; let it be known that Belle Terre Elementary’s 3rd graders did show improvements in math and reading over the previous year’s scores by 5 points in each area. Reading went from 84% proficient to 89%. Math went from 85% to 90%. That should have been worthy of being mentioned in the article.