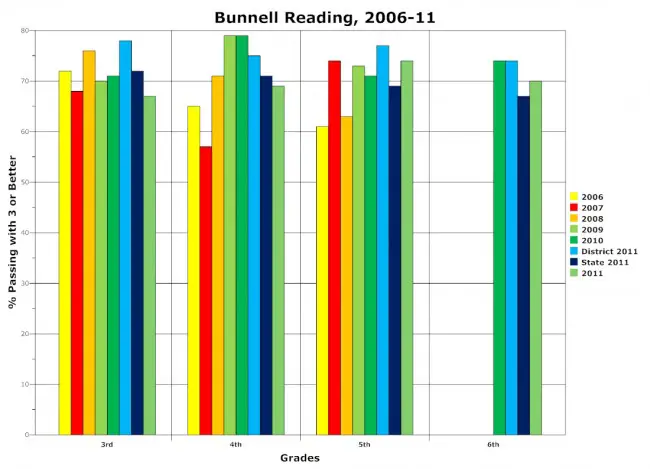
Bunnell Elementary's FCAT Reading Success Rate
| The Numbers by Year | 3rd | 4th | 5th | 6th* |
|---|---|---|---|---|
| 2006 | 72 | 65 | 61 | 0 |
| 2007 | 68 | 57 | 74 | 0 |
| 2008 | 76 | 71 | 63 | 0 |
| 2009 | 70 | 79 | 73 | 0 |
| 2010 | 71 | 79 | 71 | 74 |
| 2011 | 67 | 69 | 74 | 70 |
| District 2010 | 78 | 77 | 74 | 72 |
| State 2010 | 72 | 72 | 69 | 67 |
| District 2011 | 78 | 74 | 77 | 74 |
| State 2011 | 72 | 71 | 69 | 67 |
![]()

![]()
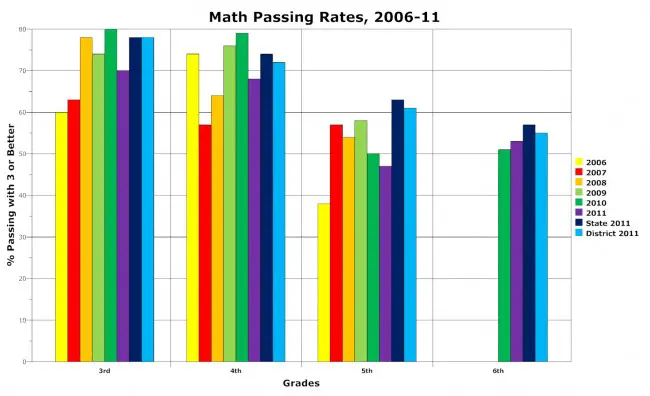
Bunnell Elementary's FCAT Math Success Rate
| The Numbers by Year | 3rd | 4th | 5th | 6th* |
|---|---|---|---|---|
| 2006 | 60 | 74 | 38 | 0 |
| 2007 | 63 | 57 | 57 | 0 |
| 2008 | 78 | 64 | 54 | 0 |
| 2009 | 74 | 76 | 58 | 0 |
| 2010 | 80 | 79 | 50 | 57 |
| 2011 | 70 | 68 | 47 | 53 |
| District 2010 | 80 | 75 | 56 | 57 |
| State 2010 | 78 | 74 | 63 | 57 |
| District 2011 | 78 | 72 | 61 | 55 |
| State 2011 | 78 | 74 | 63 | 57 |


Leave a Reply