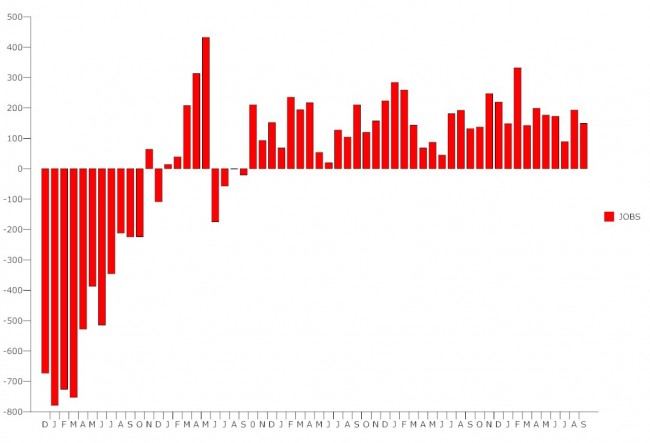
The September unemployment report due on Oct. 4 was released only at 8:30 this morning, delayed by the 16-day government shutdown. But it could have been predicted, as it follows the pattern of most reports of the past three years: anemic job growth, very slow decline in the unemployment rate, and checkered signs of improvement (or retreat, depending on your point of view) ahead.
The unemployment rate fell to 7.2 percent, the lowest rate yet in the nearly five years of the Obama administration, and the lowest rate since November 2008, when it was at 6.8 percent and zooming up. It is the 13th month in a row that the rate has been in the 7 percent range. On the other hand, it continues to trend in the right, downward direction. But job creation was a sluggish 148,000, not enough to keep up with the natural growth in the labor pool. The numbers for July and August were revised to show an additional 9,000 new jobs.
Some 11.3 million Americans remain unemployed. But that’s by the standard, and effectively inaccurate, measure of counting only those who still are looking for work, and not counting those who work part time because they can;t find full time work. When discouraged workers and 7.9 million involuntary part-time workers are included, the so-called U-6 unemployment and under-employment rate stands at 13.6 percent. In Florida, that rate is 15.1 percent, ranking the state 11th-worst in the nation in that category. The national average is 14.3 percent.
The numbers are outdated in two regards. First, they’re three weeks late. More significantly, they offer a jobs picture unaffected by the government shutdown, which most economist say will have a clear effect on next month’s report, due in 17 days. It will not be until the January report, reflecting December numbers, that the jobs picture will return to normal, in the sense that the numbers won’t be affected by the shutdown.
Key data showing underlying strengths and weaknesses of the labor market remained unchanged in September: the labor participation rate stayed at 63.2 percent, well below pre-recession levels of 66 percent. The employment-to-population ratio remained at 58.6 percent, down from the 62 to 63 percent range before the recession, and not much different than where it’s been since 2010.
The unemployment rates for adult men was 7.1 percent, adult women, 6.2 percent, teenagers, 21.4 percent, whites, 6.3 percent, blacks, 12.9 percent, Hispanics, 9 percent, and Asians, 5.3 percent.
A few highlights: Employment in construction rose by 20,000 in September, after showing little change
over the prior 6 months. Employment in wholesale trade rose by 16,000, transportation and warehousing added 23,000, professional and business services added 32,000, temp help services added 20,000, and auto dealers added 4,000 jobs. Health care added 7,000.
Employment in credit intermediation and related activities declined by 8,000 in September. Food services and bars lost 7,000 jobs. Employment in other major industries, including mining and logging, manufacturing, information, and government, showed little change in September.
The average workweek for all employees on private nonfarm payrolls was unchanged in September at 34.5 hours. In manufacturing, the workweek was 40.8 hours, the same as in August, and overtime was unchanged at 3.4 hours. Average hourly earnings for all employees on private payrolls rose by 3 cents to $24.09. Over the year, average hourly earnings have risen by 49 cents, or 2.1 percent, not enough to overcome the effects of inflation. Average hourly earnings of private-sector production and nonsupervisory employees rose by 4 cents to $20.24.


Robert says
National stats are fine. The question is what is happening here in the county and city.
One report a few months ago showed that wages have declined in this county/city. The median income was about $26,000 per year that is $12.50 per hour.
If one is looking for gainful employment with upward mobility the choices are few.
Have a friend or family member in the county
Have a friend or family member in the city
Have a friend or family member in the school department
Commute to another large city
Move away.
djsii says
It is always good to look at these types of data and try to understand their meaning. One set of numbers, such as this though, really fail to tell the whole story. For instance, during this same timeframe what has been the Decrease/Increase in other social data such as welfare recipients, SSI recipients, food stamp recipients, number of people who retired, etc…….you get the picture. It is great that we have been in “positive” numbers within the job market for the past 4 years but, are we really gaining or losing based upon other demographics that impact our economy. I certainly do not profess to have that answer but, I would be interested in seeing what it would look like.