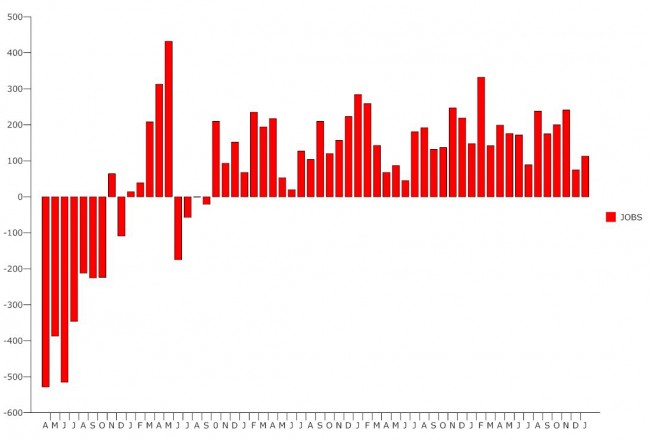
The national unemployment rate continues its steady downward fall, to 6.6 percent in January–its best showing since the 6.5 percent rate recorded in October 2008, when it was on its way up–but for the second month in a row, job creation fell far short of expectations, to 113,000. It was a revised 75,000 in December, the worst successive two-month results in a year and a half.
The Labor Department’s jobs report is always based on two separate surveys: the so-called establishment survey, which is more reliable, and the household survey. The establishment survey polls 140,000 businesses and government agencies representing about 410,000 worksites. The separate household survey is based on data gathered from 60,000 households representing 110,000 individuals, still a far larger sample than virtually all opinion polls, which top off at 2,000 participants.
In contrast with the establishment survey this month, the household survey shows a sharp increase of 616,000 jobs, and a jump of 0.2 percent in the employment-population ratio. The household survey data this month reflects updated population estimates the Labor Department notes.
The alternative rate of unemployment–the so-called U-6 rate–which takes into account people who have dropped out of the workforce as well as people working part-time because they cannot find full-time work or have seen their hours cut back, also shows a sharp improvement, to 12.7 percent, the best rate since November 2008. It was 13.1 percent in December.
In sum, the January jobs report is a mixed bag, with more questions than answers. Those questions may not get answered until subsequent jobs reports.
Some 10.2 million American remain unemployed. But the civilian labor force rose by half a million people in January, and the labor force participation rate, which had been declining most months, rose back to 63 percent, after falling to a 62.8 percent the previous month. The rate is an indication of the number of people willing or able to work. It peaked in 1999 just above 67 percent, but has now returned to levels of the late 1970s and early 1980s, driven down in part by workers too discouraged to continue looking for jobs, but also by the retirement of baby boomers: the more people retire, the smaller the labor participation rate. Regardless of the strength of the economy, the rate is expected to continue to decline in coming years as bulk of baby boomers retire, unless immigration makes up for the attrition.
A few highlights by sector: Construction added 48,000 jobs over the month, more than offsetting a decline of 22,000 in December. Manufacturing employment increased by 21,000, wholesale trade added 14,000 jobs, mining added 7,000, professional and business services added 36,000, and leisure and hospitality 24,000. Health care, which was averaging 17,000 a jobs a month in 2013, added no jobs in January.
Employment in retail trade fell by 13,000. Federal government employment decreased by 12,000, much of it from a 9,000 job loss in the U.S. Postal Service. Employment in other major industries, including transportation and warehousing, information, and financial activities, showed little or no change over the month.
The average workweek for all employees on private payrolls was unchanged at 34.4 hours. Average hourly earnings rose by 5 cents to $24.21. Over the year, average hourly earnings have risen by 46 cents, or 1.9 percent.


Reaganomicon says
Question: how many people moved from unemployment to disability? It’s my understanding that this is a growing trend, and disability numbers are not included in employment statistics. Note that I’m not calling anyone a deadbeat, I am simply pointing out one gigantic ignored flaw in unemployment statistics.
Mario says
The nation’s unemployment rate does not include millions of workers who have given up jobs searches, or could only find part-time work. If those workers were counted as unemployed, the rate would exceed 10 percent. More than 20 million Americans, are unemployed, underemployed, or so discouraged by job prospects that they have stopped looking for work.
FlaglerLive says
Mario, that’s why the unemployment report always refers to the U-6 unemployment rate, which does take into account discouraged workers and the underemployed. Taking those factors into account, the U-6 rate is at 12.7 percent, or double the traditional unemployment rate. Those figures are in the article above.
Diana L. says
As our politicians spend their time on defining marriage, making it harder to vote, weather a woman can use birth control pills, drug test welfare recipients-with proof that the number of people using welfare and drugs are very small, WE HAVE NO JOBS. Grandstanding, playing to their base and worrying about their next election is what is on their mind, not us, NOT US, NOT US………
Outsider says
You forgot to mention trying to provide everyone free healthcare, having those who are working pay for those who won’t. You can’t get away from the fact that taking trillions away from investment via taxes has a profound effect on the economy. When will you Obama fans face up to the fact that after five years of promises and money printing it’s not working?
George says
These graphs and lies about how well America’s unemployed are doing is a “crock”. They LIE and have been lying for 25 years. When factory and industrial jobs started leaving America, millions become unemployed. Some went on government assistance, others part time jobs, and still others just become homeless and desperate . As the years past, the government HID the real numbers and continued to allow illegals into the country. More companies moved over seas because of high taxes. This created the “employment hell” we have today…..Its NOT getting better and never will until we send 100 million illegals back to their own countries, and bring industrial, factory, and infrastructure jobs back to America.