On one hand, 2016’s estimated taxable values are disappointing, at least in relation to last year: they’ve risen less than in 2015 in all of Flagler County’s major towns, the county and the school district, which means increases in tax revenue will likewise be proportionately less than last year’s, assuming tax rates remain what they are.
The decrease is especially pronounced in Palm Coast. Last year taxable values rose 5.6 percent there. This year? Just 3.88 percent, based on June 1 estimates by the Flagler County Property Appraiser. And just 1.8 percent of the increase is due to new construction. Flagler County last year saw a healthy increase of 6.75 percent. This year’s increase is estimated at just past 5 percent, with 2 percent due to new construction. Local officials keep an eye on the new-construction figure because it’s considered free money: it adds to the revenue stream without figuring as a tax increase. But when construction is anemic and governments need more money to keep up with the demand for services, then tax increases become necessary.
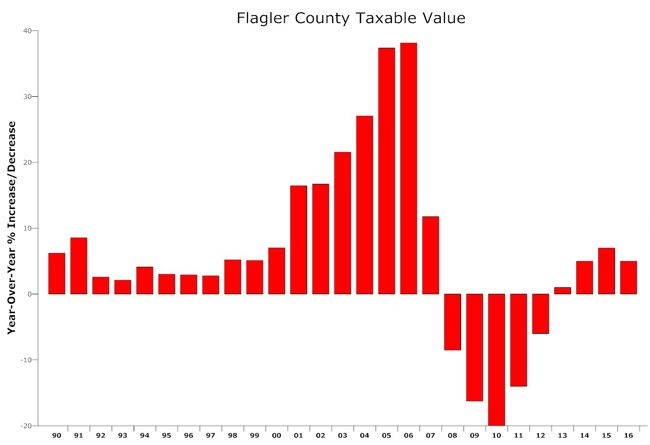
On the other hand, the numbers can be seen as very healthy indeed, especially in relation to historical averages. The housing boom of the last decade got residents in Flagler County and Florida in general used to staggering increases in property values. From 2001 to 2006 (see chart above), those annual increases approached 20 percent, then 30 percent, then 40 percent in the last two years of the boom.
Those were abnormal, unsustainable and ultimately damaging increases that led to the crash, the most severe recession since the Great Depression, and the loss of values over five successive years. The county is still recovering that loss.
In 2013, values went up again for the first time in six years, albeit just nominally. But for the three years after that, including 2016, values have been improving at a faster clip than in the normal years before the boom. In the eight years between 1992 and 1999, property values increased an average of 3.5 percent a year. In the past three years, they have been increasing at a rate of 5.7 percent a year. So even Palm Coast’s 3.88 percent increase this year is ahead of the pre-boom average. The increases are also well ahead of inflation, which has been close to zero. So from a property owner’s perspective, the 2016 numbers are a dampener only in relation to last year’s, or in relation to the warped memories of the great boom. In historical terms, the numbers are solid, if not on the high side.
And they may yet improve. “It’ll probably be a little more than that by the time we’re done,” Property Appraiser Jay Gardner said Thursday: his office is still refining totals.
And there are several reasons why values are not increasing faster, he said: the 10 percent cap in how much a non-homesteaded property’s increased value may be taxed is beginning to take effect. For example, if a commercial property experiences an increase of 15 percent in its assessed value, only 10 percent of that may be taxed. The same principle applies to homesteaded properties, with a 3 percent cap on how much any such property’s value increase may be taxed. The 3 percent cap has been in place many years. The 10 percent cap went into effect with the 2009 tax rolls, but is only now beginning to take a bite out of government revenues.
“All the gifts we give ourselves” in tax exemptions take their toll on government revenue, the property appraiser says.
Other exemptions the Legislature, voters and local governments approved are also just now beginning to have an impact. For example, people who have been in their home for 25 years or more can benefit from an exemption on the first $250,000 in their property’s value, a significant tax break for long-time residents but just as significant a subtraction in revenue for local governments. That exemption only applies to county taxes, not to city, school or other taxes, such as the mosquito control district (where it applies), or the St. Johns River Water Management District. Seniors and veterans get additional exemptions. The $50,000 homestead exemption most homeowners are familiar with also applies only by half when it comes to school taxes.
Still, as exemption after exemption accumulates—what Gardner calls “all the gifts we give ourselves”—the hit on government revenue is significant: Without all the exemptions, the just-value increase in taxable property would have been 8 percent in the county, Gardner said, fully three percentage points higher than the actual figure. The generosity and multiplicity of exemptions “stifles some of the money we’d have thrown into the tax rolls.”
“At the end of the day we did have a nice increase this year, it’s not quite as strong as it was last year,” Gardner said.
Now governments have three choices come fall, when they adopt their property tax rates for next year. They can adopt the so-called rolled-back tax rate. That’s the rate they would have to adopt in order to bring in no more revenue next year than this year (outside of revenue generated by new construction). That means they would be decreasing the tax rate somewhat, but not increasing the effective tax on property owners. Although not unlikely, the chances of that happening this year are a bit slim, though it happened in Flagler Beach last year.
Their second choice is to decrease both the tax rate and the effective tax bite on residents. That would require lowering the tax rate past the rolled-back rate. It would reduce government revenue. You can pretty much bet that you won’t see that happen this season. Governments across the board are still trying to catch up with projects delayed by the retrenchment of the Great Recession. And even though it’s an election year, when candidates running for reelection might be tempted to bribe their constituents with lower taxes, the crop of candidates currently in office has historically not been that irresponsible.
The third and likeliest possibility is that governments will either keep their current tax rate, which will effectively equate to a tax increase nearly equivalent to the improvement in tax valuations in their jurisdictions (that is, 5 percent in the county, 4 percent in Palm Coast, and so on). Or they will actually increase their tax rate modestly, as the county has already suggested it might do. County government faces a slew of added costs, among them health insurance and salary increases made necessary by a brain drain the county would like to staunch. But whatever the increase may be, it would be limited.
All of that is being decided as local governments have already begun the most laborious part of their annual duties: budget season, which stretches across the summer months, takes up numerous workshops and meetings, and culminates with two public hearings where the public gets a chance to weigh in—although this year, the public is getting that chance during workshops as well, now that even Palm Coast government has finally dispensed with its lid on public participation and adopted the county’s more inclusive method of giving members of the public a chance to speak at the end of every workshop.
![]()
June 1, 2016 Estimate of Taxable Value
| Taxing Authority | 2014 Final | 2015 Final | 2016 Estimate | Percent increase | New Construction Dollar Value |
|---|---|---|---|---|---|
| Town of Marineland | $3,571,334 | $3,694,290 | $4,800,000 | 29.93% | 0 |
| Town of Beverly Beach | $48,190,295 | $54,164,402 | $59,000,000 | 8.93% | $3,579,637 |
| City of Bunnell | $143,195,702 | $150,592,606 | $154,000,000 | 2.26% | $771,500 |
| City of Flagler Beach | $488,420,240 | $532,443,692 | $565,000,000 | 6.11% | $7,419,688 |
| City of Palm Coast | $3,892,358,641 | $4,129,619,115 | $4,290,000,000 | 3.88% | $77,691,833 |
| East Flagler Mosquito Control | $6,248,120,455 | $6,668,486,786 | $7,020,000,000 | 5.27% | $129,010,561 |
| St. Johns River Management District | $6,677,046,129 | $7,130,202,650 | $7,510,000,000 | 5.33% | $148,414,471 |
| Inland Navigation District | $6,677,046,129 | $7,130,202,650 | $7,510,000,000 | 5.33% | $148,414,471 |
| Flagler County | $6,538,506,828 | $6,987,545,919 | $7,350,000,000 | 5.19% | $147,701,300 |
| Flagler County Schools | $7,423,261,366 | $7,938,754,018 | $8,350,000,000 | 5.18% | $153,026,712 |


Leave a Reply