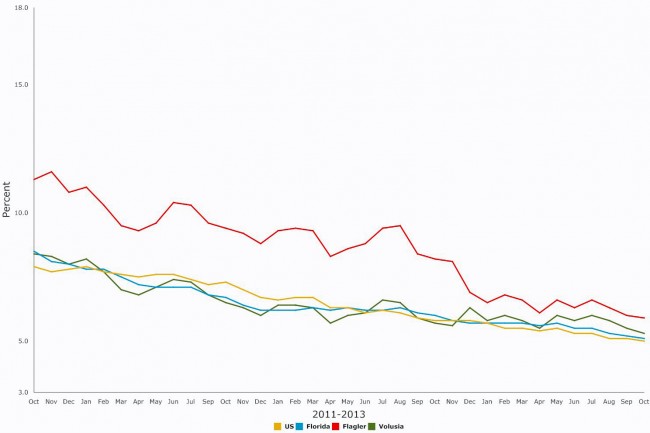
Flagler County’s unemployment rate fell to a post-recession low of 5.9 percent in October, the first time since 2007 that it has been below 6 percent, continuing a steady trend downward. The last time the local unemployment rate was this low was in November 2007.
In the intervening years, the unemployment rate rose to almost triple that level and kept Flagler at the top of the state in unemployment. But the much-improved jobs numbers are also in very stark contrast with eight years ago: In October, 40,332 county residents held jobs, compared to 32,604 in October 2007, when the unemployment rate was 5.8 percent, an increase of 7,728.
Of course, the population has increased since then. In 2007, Flagler County had a population of 88,000. Today, it has a population of around 100,000, a 13.6 percent increase. Even so, there’s been a 23.7 percent increase in the number of people holding jobs, underscoring a key reality in Flagler County’s mending economy: the local economy hasn’t merely improved, it has added jobs at a much higher net pace.
The workforce has grown, too. It was 34,625 in October 2007. It has grown to 42,859 according to the state labor department’s October figures, a 23.8 percent increase.
In October, however, the local labor force shrank somewhat, by 209 workers, and it remains 355 workers smaller than it was a year ago. And month-over-month, there were 148 fewer jobs held by Flagler County residents in October, compared to September. The shrinking labor force helped push the unemployment rate down. At the same time, the jobless rolls were pared by about 60, which also helped bring the rate down. That suggests that the county may have lost a few working families over the month.
But the broader trends remain solid.
In Florida, the seasonally adjusted unemployment rate was 5.1 percent in October, down 0.1 percentage point
from the September 2015 rate of 5.2 percent, and down 0.7 percentage point from 5.8 percent a year ago.
There were 492,000 jobless Floridians out of a labor force of 9.6 million. The U.S. unemployment rate was 5.0
percent in October.
Florida’s seasonally adjusted total nonagricultural employment was 8.1 million in October, an increase of 35,200 jobs over the month. Industries seeing declines in employment included commercial equipment wholesalers (800 jobs), gas stations (400 jobs), broadcast media (200 jobs), amusement parks (200 jobs), construction (2,800 jobs), durable goods manucaturing (1,000 jobs), and hotels and motels (1,800 jobs). Industries gaining jobs included auto repair shops (2,400 jobs), health care and social assistance (10,200 jobs), educational services (7,100 jobs), administrative and waste services (17,800 jobs), and retail (14,700).
CareerSource Flagler and Volusia issued the following numbers:
The October 2015 unemployment rates in the counties that comprise the CareerSource Flagler Volusia region were 5.3 percent in Volusia County and 5.9 percent in Flagler County. Nonagricultural employment in the Deltona‐Daytona Beach‐Ormond Beach metro area (Flagler and Volusia counties) was 187,600 in October 2015. Total nonagricultural employment was up 4,400 jobs (+2.4 percent) over the year.
The Deltona‐Daytona Beach‐Ormond Beach metro area tied for second‐highest over the year growth in manufacturing employment (+400 jobs) out of all Florida metro areas. Professional and business services (+7.2 percent), manufacturing (+3.8 percent), and government (+2.1 percent) grew faster in the metro area than statewide. Seven of the ten major industries gained jobs over the year, led by professional and business services (+1,500 jobs) and followed by education and health services (+1,300 jobs); trade, transportation, and utilities and government (+500 jobs each); manufacturing and leisure and hospitality (+400 jobs each); and financial activities (+200 jobs). Other services (‐300 jobs) and information (‐100 jobs) lost jobs. Mining logging, and construction
remained unchanged.
![]()
Click to access unemployment-october-2015.pdf


yellowstone says
Hum-m-m, look at that chart and see when UNemployment began.
Then look again at where UNemployment started downward and employment started back up.
Now think about which respective political administration made each of these events happen.
Surprised?
Well blame it on Obama, of course.
Dave says
Lets see Obama in office January 20, 2009 , employment was on the way up around Oct 07 before Obama took office and then watch the numbers, they move all move downward.
Ron R. says
I don’t think you understand the chart, Dave. This chart is showing UNemployment rates – not employment rates.
The UNemployment rate starts decreasing around October ’09. In other words more jobs began being filled after Obama took office.
Mike says
Fear not Republicans! If you win office in 2016, I trust the unemployment rate will race back up!