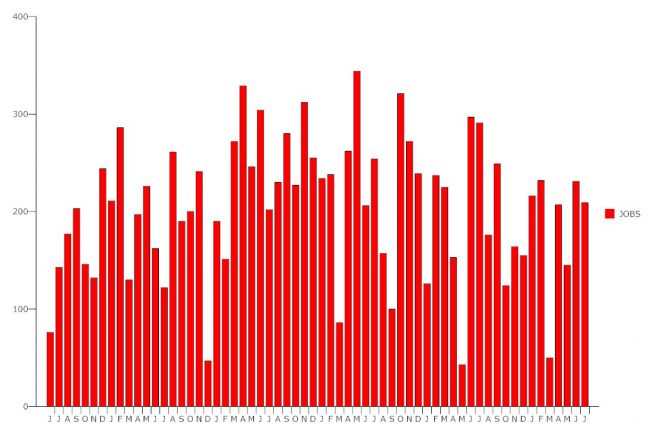
Call it the the final waves of the Obama economy or the first indications of the Trump economy: either way, the national economy continued its record expansion for its 82nd straight month, adding 209,000 jobs in July and dropping the traditional unemployment rate to 4.3 percent, a level not seen since May 2001, when the Clinton boom was ending.
President Trump, who only last year was calling similarly buoyant job-creation numbers a “bubble,” this morning was taking credit for the July figures, “and I have only just begun,” he wrote in a tweet 15 minutes after the U.S. Labor Department announced the jobs numbers. “Many job stifling regulations continue to fall! Movement back to USA!”
It is a startling change of tune. As a candidate Trump had also regularly discredited unemployment figures, calling the numbers “fake,” “phony” or “false” 19 times, saying the unemployment rate was lower than it really is and placing the actual figure, in his estimation, “anywhere from 18 to 20 percent. Don’t believe the 5.6. Don’t believe it.” (That was in June 2015.) As recently as last December, when 1545,000 jobs were created, he was calling the figures “totally fiction.”
Trump isn’t entirely wrong: the traditional unemployment figures mask the underlying nuances of under-employment and of those who have dropped out of the workforce altogether, even though they’re still of working age. But the Bureau of Labor Statistics has never hidden those numbers. It assigns them a specific category, what it refers to as the U-6, or alternative measure of employment. But even by that measure, the unemployment and underemployment rate is lower than it’s been in a decade, coming in at 8.6 percent, considerably less than the 10.1 percent of a year ago. That figure accounts for the unemployed, the discouraged, and all part-time workers who could not find full-time work, or because their hours have been cut back, even though they seek full-time employment. In July, there were 5.3 million people employed part-time for such economic reasons out of their control.
Another figure that reflects less than full employment is the labor force participation rate, which was 62.9 percent in July, and the employment to population ratio, at 60.2 percent. The participation rate was as high as 67 percent until the 2001 recession, but has been falling since, particularly after the 2008 recession. That’s been driven in large part by the retirement of baby boomers: between 2004 and 2014, the Bureau of Labor Statistics saw an annual increase of 2.6 percent in the number of people 65 and older who dropped out of the workforce, by far the largest growth rate of any age group up to that point. The proportion is even larger for women (3.1 percent growth a year).
For those between 16 and 54, there was actually a decline in the number of people dropping out of the workforce, with the numbers picking up again for those 55 and older. In other words, as Americans get well into middle age, they are choosing to retire earlier. In other words, it’s not simply a matter of Americans not finding work when they do choose to be part of the labor force, but of Americans choosing to drop out because they can afford to. Younger people, who don’t have accumulated assets, are not dropping out.
Wages have been of more concern to workers, with stagnation prevailing for several years until about 18 months ago, when wage growth has edged slightly ahead of inflation. Without wage growth significantly ahead of inflation, standards of living either stay in place or fall. In July, average hourly earnings for all employees rose by 9 cents to $26.36, and by 65 cents for the year, a 2.5 percent increase: not very strong, but just enough to seem like a relative improvement.


Sw says
GDP growth 1%+ oooh