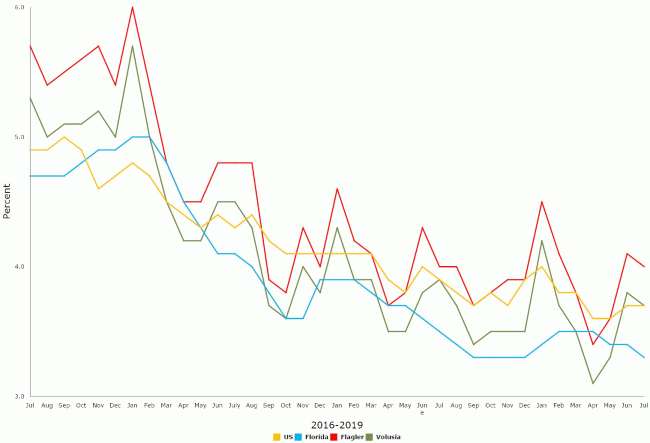
Flagler County’s 4 percent unemployment rate barely budged in July from 4.1 percent the month before–or a year ago: the county’s unemployment rate has seesawed within a narrow band for a year and a half, though the labor force, an indication of population and economic strength, has continued to grow steadily as it nears the 50,000 milestone.
The Flagler-Palm Coast labor force grew by more than 200 people in July, to 48,631, while the number of people with jobs grew by about 250, to 46,701, a growth of more than 2,000 jobs compared to a year ago: most months for the past year and a half, Flagler County’s employment numbers have set new records. That doesn’t mean that there are 46,701 jobs in Flagler proper, but that 46,701 people who live in Flagler are working. The number also doesn’t distinguish between full and part-time employment, with even one hour’s work recorded during the period surveyed counting as an employed person.
There were 1,930 people unemployed in July in the county, a decrease of 54. The unemployment rate did not fall accordingly because of the much larger increase in the labor force. That increase suggests that people are encouraged to move to the county, or that people previously unemployed are encouraged to return to the workforce. Labor force numbers also point to a relatively younger demographic–people with families or younger people starting out, as opposed to retirees: people 65 and over make up 30 percent of the county’s population (as opposed to 17 percent accounting for people younger than 18.)
Flagler’s numbers are not seasonally adjusted. Statewide, the July unemployment rate fell a decimal point to 3.3 percent, with 22,900 new jobs added despite a decrease of 5,300 jobs in local government. The loss was offset by growth in the private sector. For the first time in Florida’s history, more than 9 million Floridians held jobs in a labor force of 13.35 million. There were 344,000 unemployed Floridians, though the number is somewhat of an undercount as it does not include those who have dropped out of the labor force for being too discouraged, or those who don’t follow state rules when seeking to collect unemployment, such as showing proof of looking for work.
The federal Department of Labor maintains the so-called “alternative measure of labor underutilization,” which counts those who have left the labor force and those who work part-time for economic reasons, though they’d rather work full time: they have had their hours cut back or could not find full-time work. By that measure, the state’s unemployment and underemployment rate is at 7.4 percent, matching the national average.
Other than in local government, few sectors saw any job losses in Florida last month. The largest loss, almost 1 percent, was in arts and entertainment, with a decrease of 2,200 jobs, but construction, previously a reliably strong sector, saw a decline of 1,400 jobs. Otherwise, all other sectors saw growth, including almost 10,000 jobs in health care and social assistance.
Monroe, Okaloosa, Walton and St. Johns counties continue to be at the leading edge of economic activity, all with unemployment rates below 3 percent. Hendry County had the worst unemployment rate in the state, at 8.2 percent, ahead of Hardee, with 6.7 percent.
Last week, the Legislature’s Office of Economic and Demographic Research’s economists warned of a slowdown in Florida’s economy, with a forecast that lowered estimated revenue in the coming year by $451.6 million and by $416.1 million in 2020-21, for a two-year reduction of $867.7 million.
The full report is below.
![]()
Click to access flagler-florida-unemployment-july-2019-1.pdf


Name (required) says
Curious to know the sources of all these employment numbers locally, state, nationally, etc. Not criticizing, but how are these numbers produced, and by what source? New employee income tax data? State employment records? Federal? Pardon me for wondering, but.. always curious to know the sources and their accuracy. It seems like they’re are people that don’t even want to work in this area, or even “can’t” work? How are they accounted? What about the transient population locally ? (Hidden homeless) who are from another stare and not even known as residents? What are the demo groups? How do employers claim new employment? Who’s claiming unemployment? Is it that number vs overall populace? That’s such a grey are of explanation in article alike this, curious how these rock solid facts are indeed actually “verified.” Seems there are too many human factors to accurately report on exactly what is “employed” and “unemployed.” I take this stuff withe a grain of salt. So, great more people are working, but didn’t new people join the work marketplace at the same time? I just don’t see how these figures can be used as anything but .. generalities.